Debugging Client and Server with DevTools
If you need to catch up:
git clone git@github.com:lawwantsin/webpack-course.git
cd webpack-course
git checkout debugging
npm install
Before we wrap up our section on building the ultimate development environment, I wanted to remind you that node is as debuggable as anything run in the web browser. As of Version 61, Chrome adds this green button. This is the node logo.
When you add --inspect to your node or nodemon run, you open a web socket that chrome can use to inspect the running process. Let's add a debugger statement to express.js and see what happens.
We see nodemon restarted the server and paused almost instantly on that line. We can hover over variables to inspect them. Here's our config object for instance. Right now, we only have the one express.js file to inspect. But we can see we can dive deeper into the stack with these buttons.
Console outputs a copy of what we see in our terminal. If we type this, we see that it's the global object. Which is node's equivalent of window.
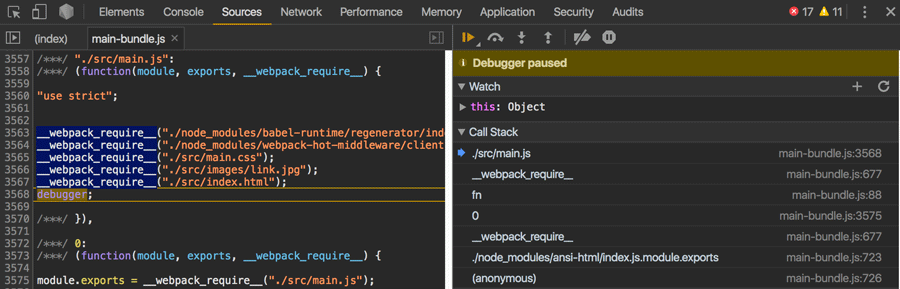
Let's do the same in the client side code. Let's insert a debugger statement in our src/main.js under the index.html require.
require("./index.html")
debugger
Watch
The Watch section lets you keep track of variables between reloads and even browser closing. Type this to get the current scope context for instance.
Call Stack
You'll notice that even though we only have 1 file to run a debugger statement in, we have a few functions that webpack is using and if we move through the stack we can see code, that's surprisingly readable. __webpack_require__ is the real beast and if you click on that in the Call Stack you can see it's definiton, live, with realtime values for these variables.
Debugging Controls
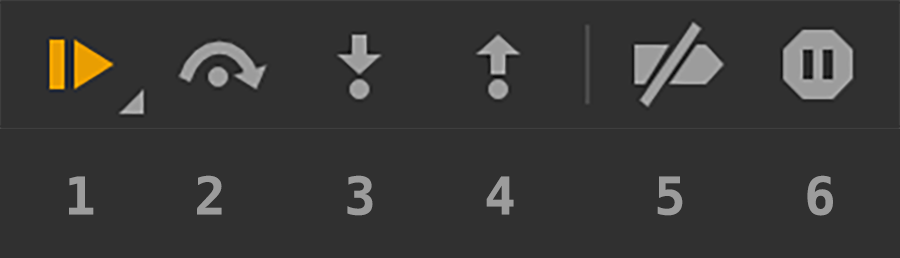
- Play/Pause the running script Hotkey is
Command+\.
- Step Over Next function Hotkey is
Command+'This might as well be called, Next. Because it moves to the next function in the same part of the stack, not moving into that function, but running it and acting like further down the stack is unpaused until it comes back up the stack and hits the next statement. - Step Into Next Function Hotkey is
Command+;moves the debugger's position into the next function it sees and stops on the first statement of that inner function. You can click the Call Stack section to move around the stack. - Step out of current function Hotkey is
Command+Shift+;moves the debugger's position up the stack. The program always runs forward. Meaning as it's coming up the stack, the functions down stack are getting run first and returning, it's just happening really fast. So, use this when you're in a stack too deep currently and want to get back to where you were before hitting Step Into. - Deactivate Breakpoints Hotkey is
Command+F8If you've set a great many break points all over the stack and don't want to delete them just yet, switch them all off here. - Pause on exceptions No hotkey. Does what it says. Can be very useful when debugging to flip this on and restart the browser. Pausing right where something is broken, checking the variables and continuing the flow is a very happy way to develop. With larger frameworks, there can be some error handling that gets in the way of using this feature effectively, but we'll get there later.
I basically wanted to introduce the debugger so you'll know what I'm doing as I move through the rest of the articles. We're going to be using DevTools a lot. Sources, Network, Performance, Audits. All of it. We'll get to in this course.
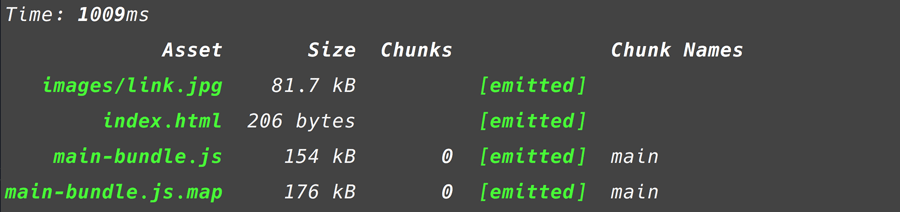
Sourcemaps
We see the debugger is paused on line 3568. Which means we're dealing with a full main-bundle.js file, not the original files. To solve this, we've got Sourcemaps. Webpack will generate a .map version of the javascript files. You'll notice it's bigger than the final file and generating a source map adds time to the build step.
In webpack.dev.js under devServer:
...
devtool: "source-map",
...
Out pops a file that you can navigate to in the browser. Pretty, I know. So long as Chrome can read it and webpack can write it, we're good.
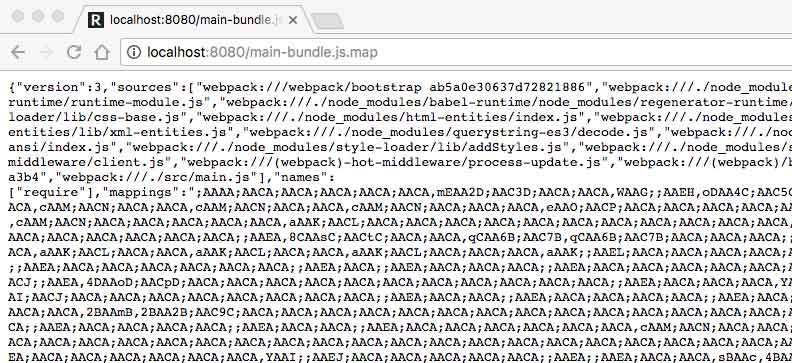
It needs to be a public file so the browser can find it and pull it in when the Dev Tools is open, just like any other piece of javascript. It contains a precise mapping, line for line from compiled final main-bundle.js to the original files and line numbers.
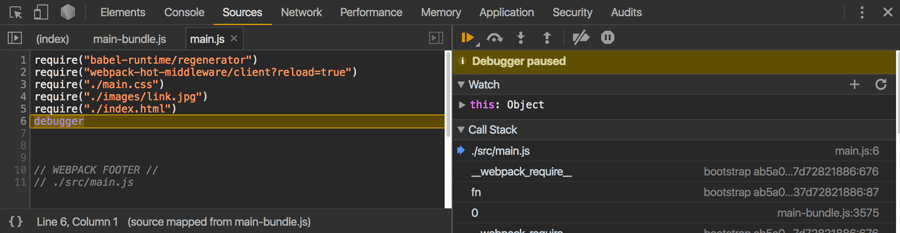
And without doing anything really at all, we see Chrome has picked up the source mapping, dropped us right where we left the debugger. Same stack of functions, but this time we have a tidy main.js instead of a colossal main-bundle.js.
In Sum
In this article we introduced a debugging experience with both client side and server side code. We'll be using the Debugger and the rest of the DevTools throughout this course.
We also discussed source maps and how easy it is to use them with Chrome and webpack.
Here is the final code:
git checkout debugging-final
This is the ultimate developer experience. Hot-reloading reactive programming, with a live debugging session from the comfort of the same DevTools we've always used. Gone are the days of console.log.